Credit card fraud is a costly and growing challenge for financial institutions. In this project, I explored over 280,000 real-world transactions to uncover patterns in when and how fraud occurs. Using SQL and Tableau, I built an interactive dashboard to visualize fraud risk across time of day and transaction amount, revealing that high-value fraud peaks between 2–4 AM. Building on these insights, I then developed a machine learning model to predict fraudulent transactions with strong performance and practical application for banks and fintech companies.
Tableau Dashboard
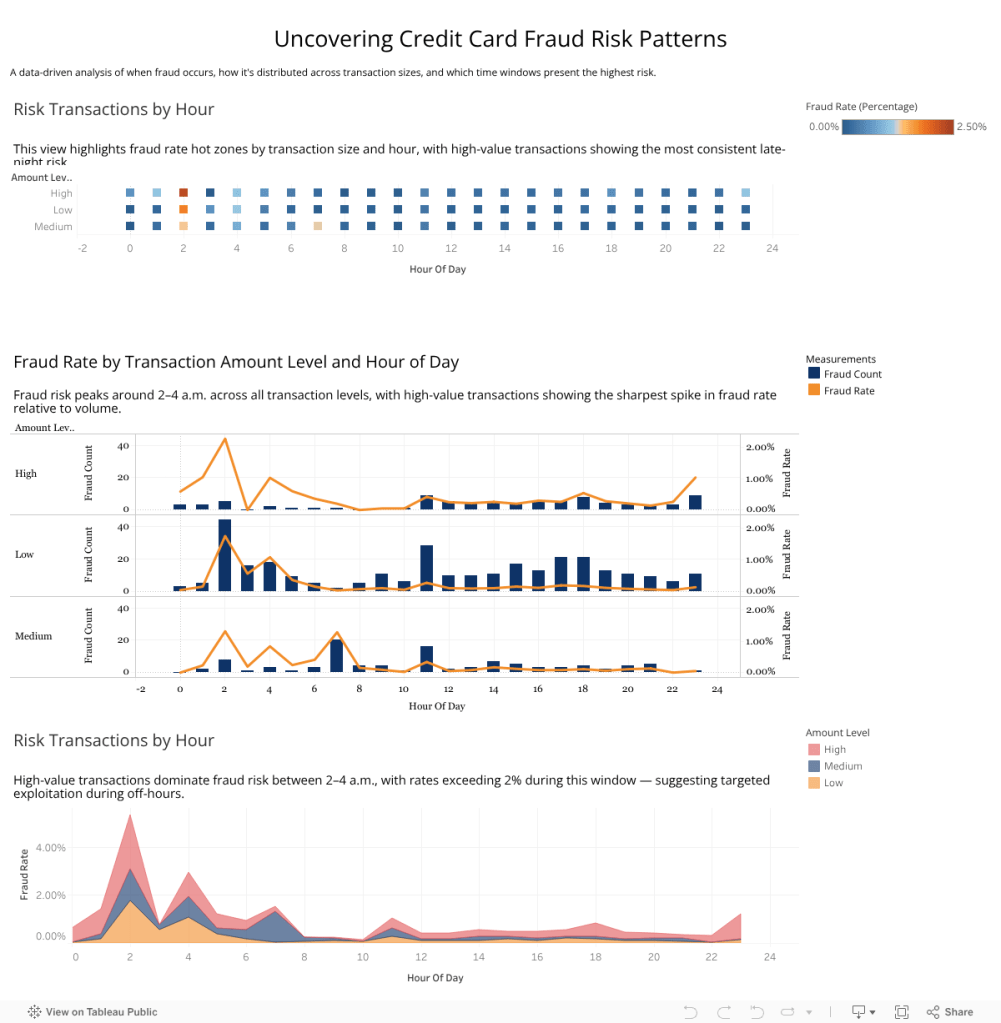
This dashboard visualizes credit card fraud risk across two key variables: hour of day and transaction amount. It reveals how fraud rates vary depending on whether a transaction is low, medium, or high value, and when during the day it occurs. A clear pattern emerges: fraud is most likely to happen between 2 AM and 4 AM, especially in high-value transactions, suggesting targeted activity during lower-surveillance hours.
The dashboard includes:
- A stacked area chart highlighting the share of risk by transaction size over time
- A dual-axis chart comparing fraud counts with fraud rate per hour
- A heatmap to instantly identify the riskiest hour-amount combinations
These insights provide banks and financial institutions with actionable risk windows and transaction tiers for enhanced monitoring.
View the live dashboard here
Machine Learning Model
To complement the dashboard’s descriptive insights, I trained and compared three supervised models that predict whether an individual transaction is fraudulent.
The key elements of my model can be found below:
| Model | Precision (fraud) | Recall (fraud) | F1 | ROC-AUC | Strength |
|---|---|---|---|---|---|
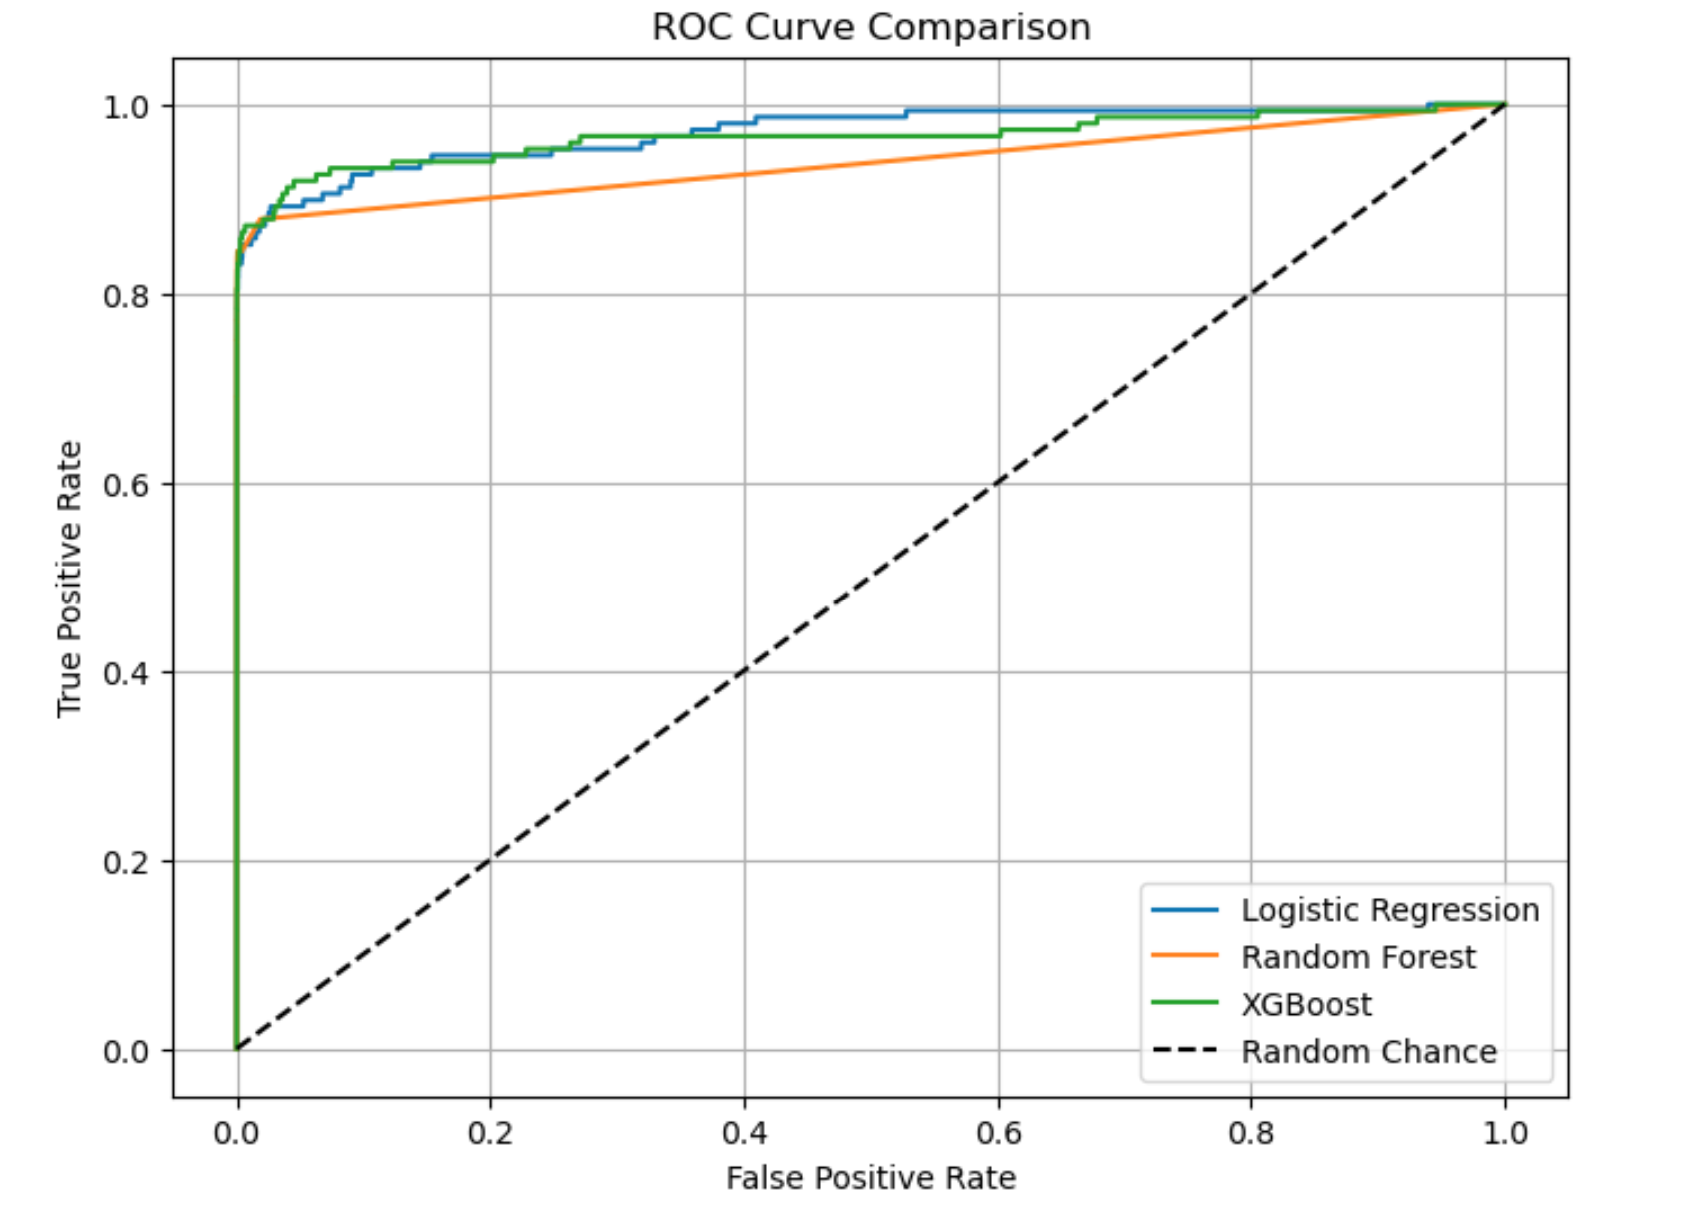
| Logistic Regression | 0.06 | 0.87 | 0.12 | 0.97 | Captures nearly all fraud (high recall) but flags many legitimate transactions. Ideal as a broad pre-screening filter when missing fraud is cost-lier than annoying customers. |
| Random Forest | 0.97 | 0.70 | 0.82 | 0.94 | Keeps false-positives to a minimum, protecting customer experience, but misses some fraud events. Suited for secondary review layers where user friction must stay low. |
| XGBoost | 0.88 | 0.78 | 0.83 | 0.97 | Best balance of precision & recall, achieving strong overall discrimination. Recommended for real-time production deployment where both accuracy and customer trust matter. |
Key takeaway:
XGBoost delivers the most practical mix of catching fraud while limiting false alarms, making it the preferred engine for live fraud-detection systems. Logistic Regression can serve as an upstream net to ensure extreme coverage, and Random Forest is valuable when minimizing customer disruptions is paramount.
ROC Curve
Confusion Matrix

